Spike train analysis software by Attila Szücs
Orbital Spike 4 - Example

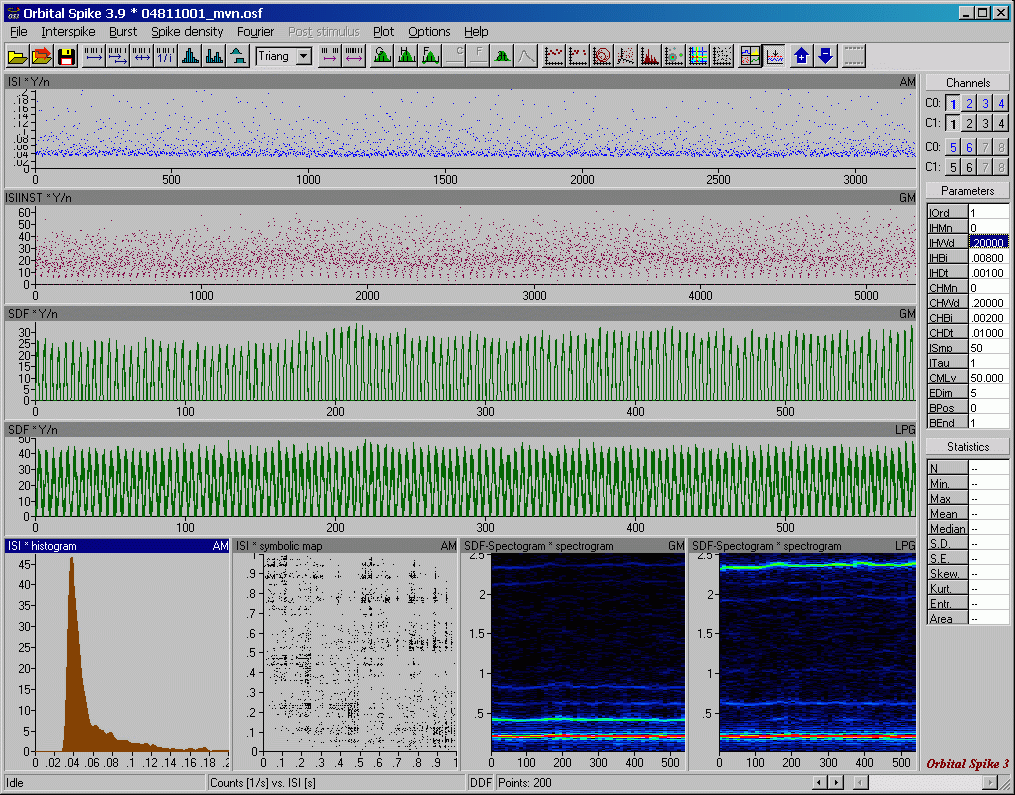
The Orbital Spike desktop is shown below. There are 4 horizontal (landsape) and 4 vertical (portrait) panels. The first panel displays sequential interspike interval (ISI) data. The seconf panel shows the instantaneous firing frequency (reciprocal of the ISI) for another neuron recorded simultaneously. The green traces are spike density functions which are essentially smooth and continuous estimators of the local firing frequency. Both SDFs are oscillatory as a result of the underlying neural bursting. The bottom left panel is an ISI probability density distribution, similar to the histogram but smoother and more accurate. The next panel is a symbolic plot calculated from the ISI sequence. The last two panels show Fourier-spectrograms of the firing rates for the two neurons recorded simultaneously. This technique is actually pretty nice, you can visualize the interactions of oscillatory patterns in single neurons. Something like gastro-pyloric interactions in the lobster stomatogastric nervous system.


